In this project, we will use three datasets about electric vehicles in Washington State. All datasets are collected and maintained by Washington State Department of Licensing, and are published on Washington Open Data. The three datasets are created on April 16, 2019, May 8, 2019, and June 1, 2020 respectively and are updated monthly with the latest update on November 15th.
The first dataset Electric Vehicle Population Data contains information about current electric vehicle registrations in WA. It has 159,467 rows each representing a registered electric vehicle, and 17 columns including VIN (1-10), County, City, State, Postal Code, Model Year, Make, Model, Electric Vehicle Type, Clean Alternative Fuel Vehicle (CAFV) Eligibility, Electric Range, Base MSRP, Legislative District, DOL Vehicle ID, Vehicle Location, Electric Utility, and 2020 Census Tract. The dataset is clean except for some undocumented entries of Electric Range and Base MSRP represented as 0, which clearly doesn’t make sense. We will analyze this further in section 2.3. Note that some vehicles registered in WA are from other states. When doing visualizations we filter those out and only focus on electric vehicles in WA.
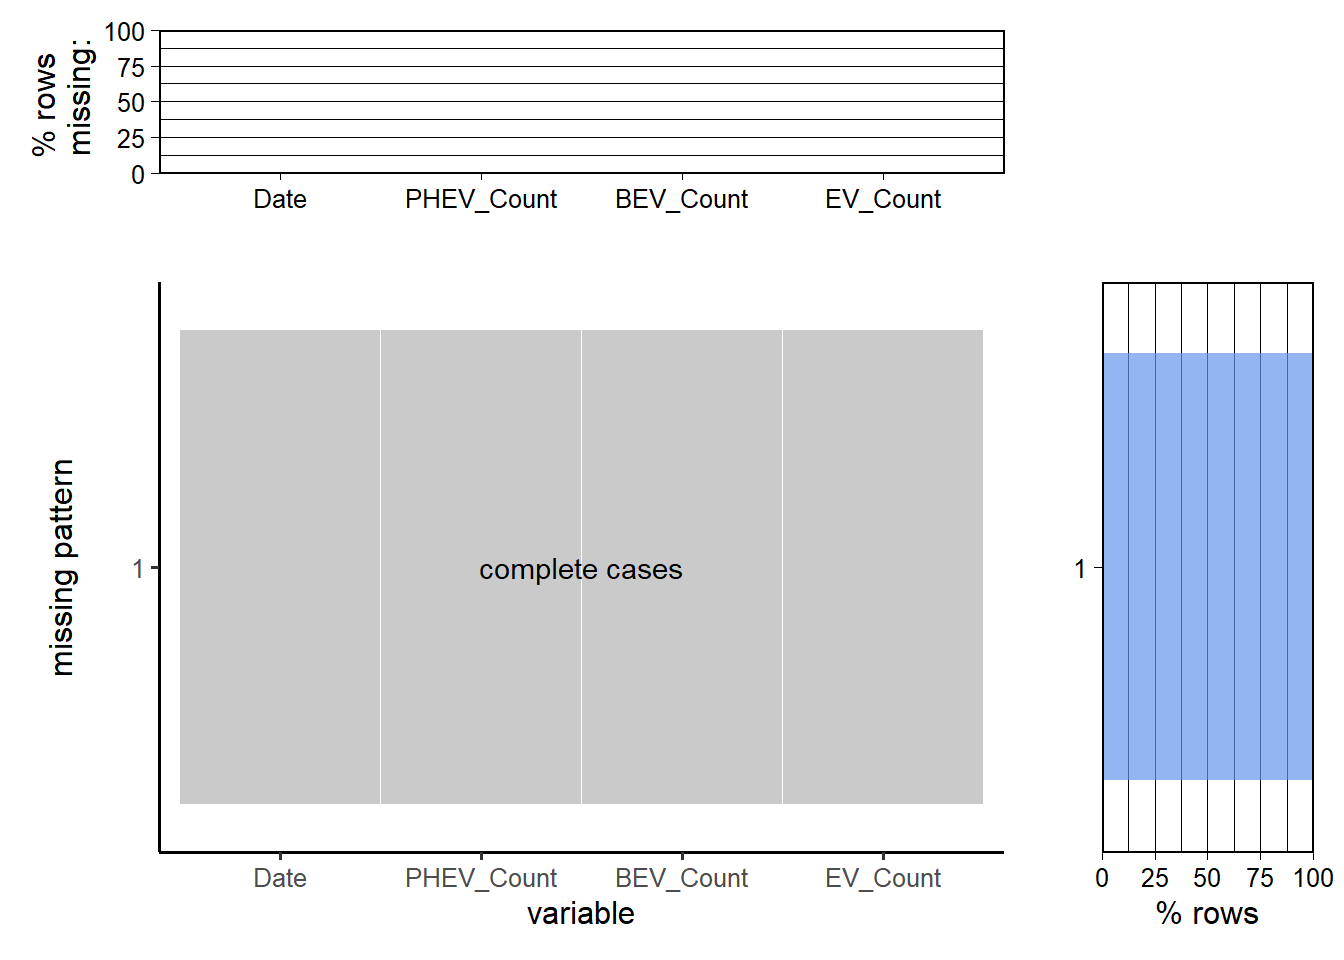
The second dataset Electric Vehicle Population Size History contains monthly updated total count of Plug-In Hybrid Electric Vehicle, Battery Electric Vehicle, and Electric Vehicle Total registered in WA from January, 2017 to October, 2023. It has 82 rows and 4 columns. This dataset is ready-to-use as it has no issues.
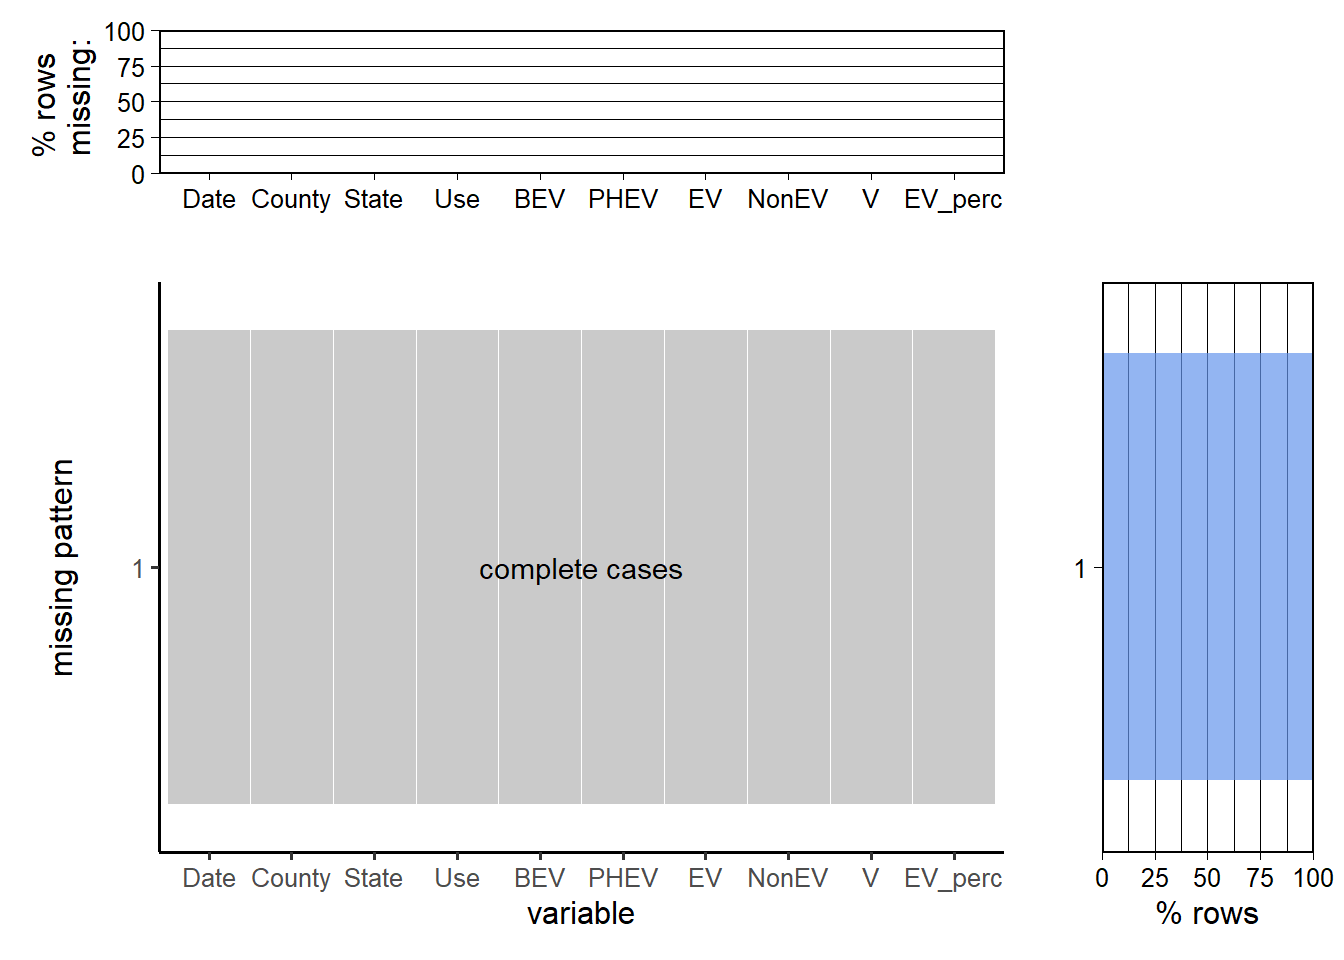
The third dataset Electric Vehicle Population Size History By County contains monthly updated count of Plug-In Hybrid Electric Vehicle, Battery Electric Vehicle, Electric Vehicle Total, Non-Electric Vehicle Total, and Electric Vehicle Percentage of different counties from February, 2017 to September, 2023. It has 19,429 rows and 10 Columns. This dataset is also ready-to-use as it has no issues. Note that similar to the first dataset, this one also contains vehicles from other states registered in WA . When doing visualizations we filter those out and only focus on electric vehicles in WA as well.
Our data source allows us to download csv files which we will then upload to our github repository for further usage.
2.2 Research Plan
Trends in Electric Vehicle Adoption
To identify the patterns of electric vehicle adoption over the years, we plan to plot a stacked bar chart based on the time series data within Electric Vehicle Population Size History dataset.
The stacked bar chart would show the size of population owning PHEV, BEV, and their sum (EV) overtime.
We choose to use the first dataset Electric Vehicle Population Data, which contains detailed information about each registered electric vehicle in WA.
We are going to plot bar charts to show the percentage of each make for PHEV, BEV, and EV. A cleveland dot plot is also suitable for displaying the ranking of different makes.
We would then draw a faceted bar chart for the count of all makes at county level.
After that, we would generate a list of interested makes. Therefore, we are able to take a closer look at customer’s preference by plotting a Cleveland dot plot of models for subset of makes.
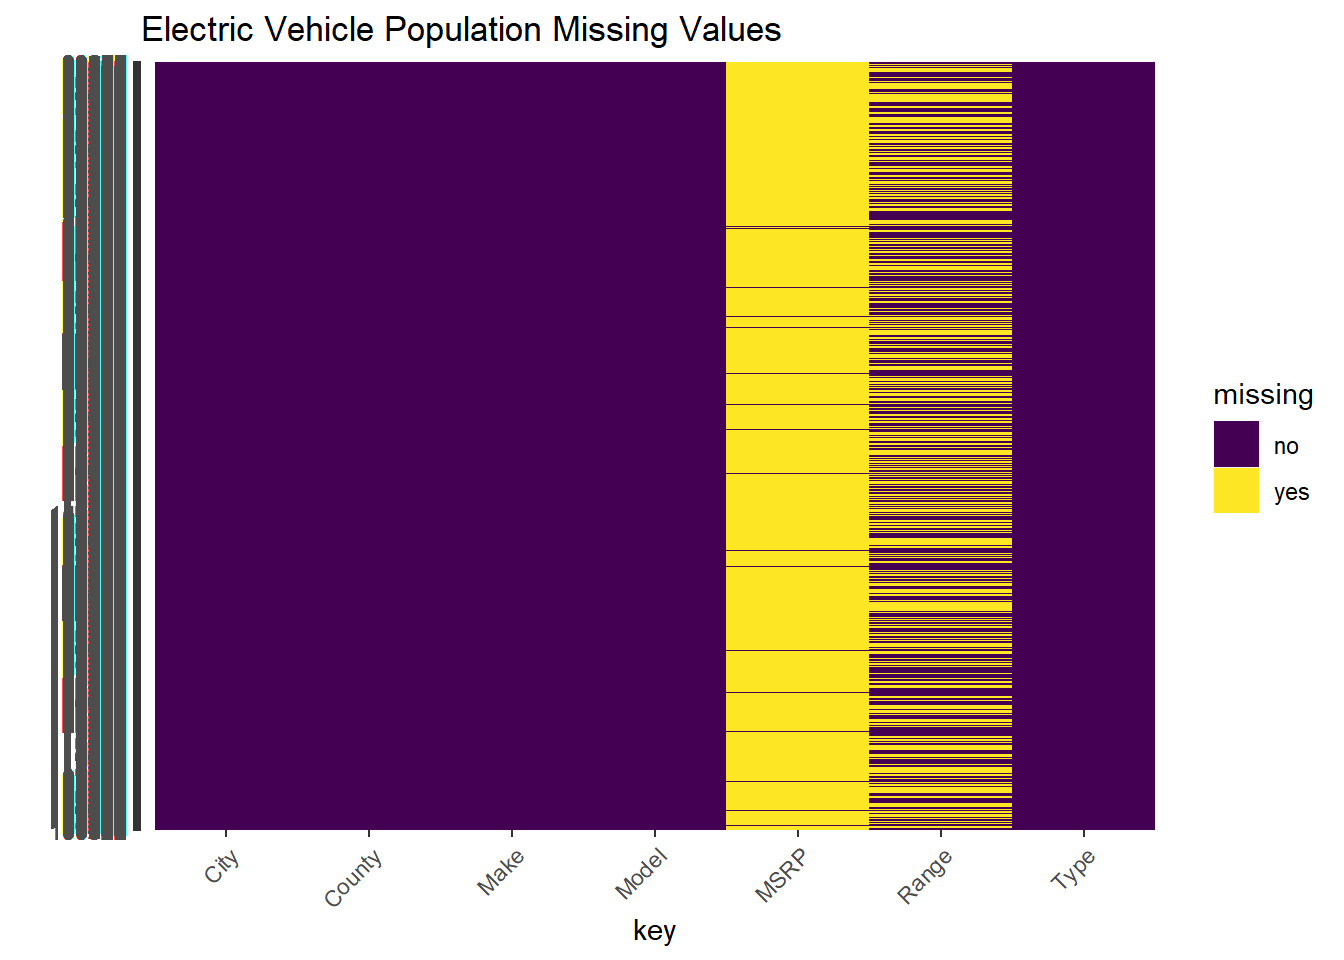
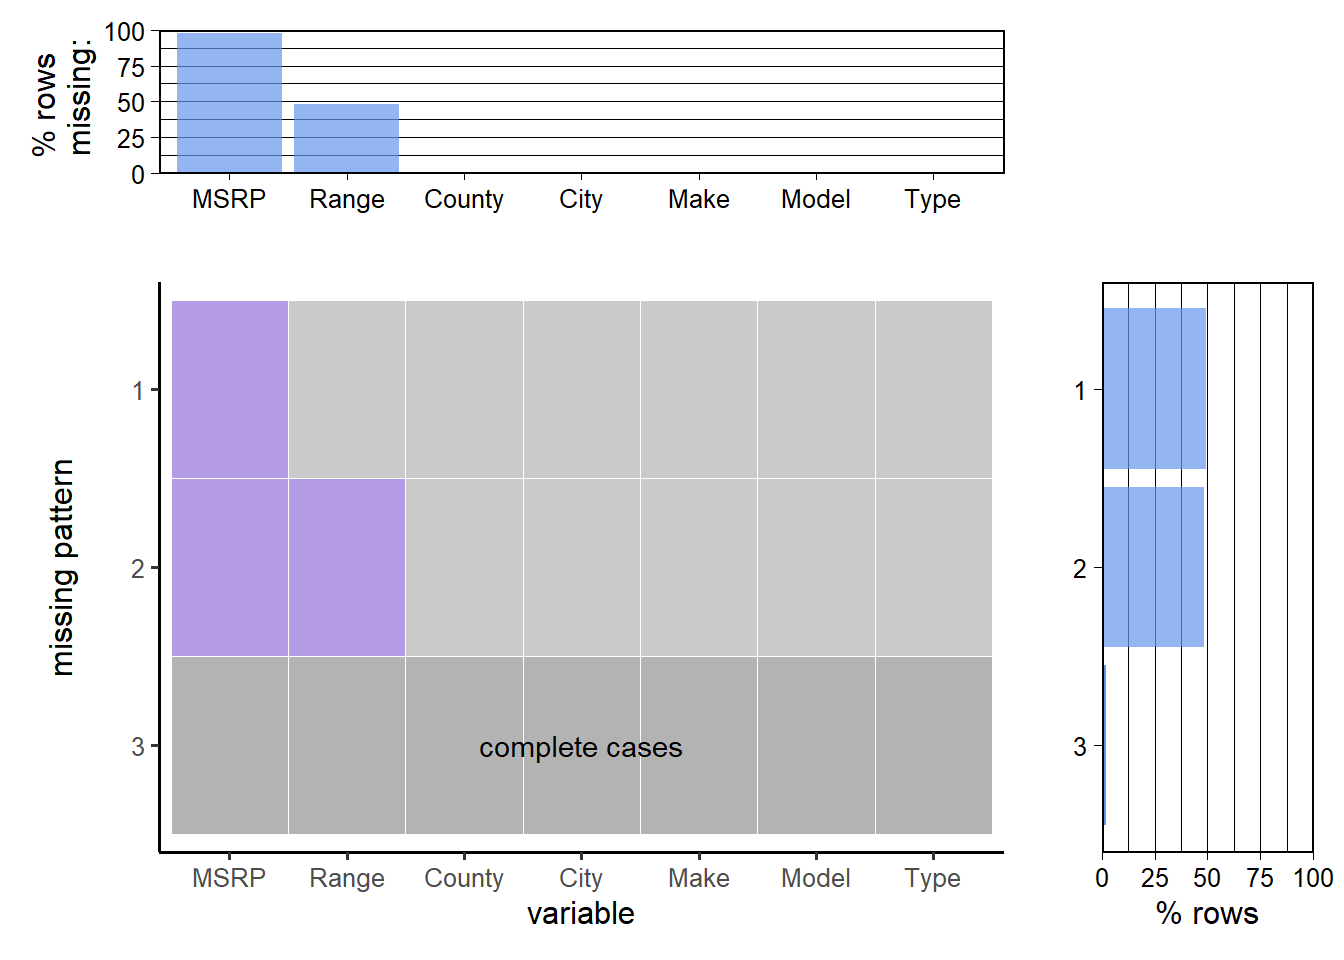
As for Electric Vehicle Population Data dataset, it might appear at first that missing values only exist in columns that we’re not interested in. However, we notice entries with value of “0” for Base MSRP and Electric Range, which clearly does NOT make sense and thus should be treated as missing values. From the graph we can tell that other variables of interest have no missing values. Almost all values of Base MSRP are missing and about a half of Electric Range values are missing, with an extremely low percentage of rows not missing values from any columns. We also notice that for some specific model, we have instances for which Base MSRP is missing and instances for which Base MSRP is not missing, similar with Electric Range. We address this issue when pre-processing the data, by filling known missing values using non-missing instances and filling unknown missing values with data provided by Kelley Blue Book.